Archive for the ‘welcome’ Category
Locality, beauty, and speed: major updates to Stormpulse
We’ve spent the last four months working on an update to make Stormpulse.com more local, more beautiful, and faster. And as of this morning, you can go and see for yourself.
Major highlights:
- Home page attempts to geo-locate and route you to a local weather page.
- Current conditions box shows current temperature, conditions, and winds.
- Forecast box shows high and low temperature and an hour-by-hour summary for the next three days.
- Map imagery with a resolution of 500 m/pixel–four times greater than our previous maps (so you zoom in four times closer).
- Speed boost: the map only loads the severe weather information it needs for your current view (no loading or rendering data needlessly).
- Map enhancements–clearer labeling and more beautiful terrain.
Those are the big items. Other items we get excited about:
- When viewed with an iPhone, the weather information is displayed in a friendly, readable fashion (and more mobile support coming soon).
- The ‘Share Map‘ feature now works for U.S. Severe Weather and allows you to share down to the plotpoint for a storm. For example, a close-up view of Katrina bearing down on NOLA. This will work for forecast positions during an active storm as well.
- Improved color scheme for severe weather alerts. In our first attempt at severe weather coverage, we adopted the National Weather Service’s colors entirely. Since then, we’ve seen a few big storms come and go, and a lot of winter storms come and go, and we’ve adjusted our colors to improve visibility on the critical alerts, and quiet down the less important ones.
- Simplified site navigation bar. Fewer choices with an expandable button at the end means less confusion, we believe.
- Intelligent expanding and contracting of weather info boxes in the left column. We are big believers in only showing what matters and hiding the rest. We’ve tried to make some smart decisions about what to hide and what to show by default. Tell us if you disagree!
Since so much of this is visual, I thought I’d include a few more screenshots that do this update justice.
A Winter Storm Watch in Hartford, CT:
Wintry weather in … Texas?! Yep.
As always, we looking forward to hearing what you think.
The Stormpulse Team
Hola, aloha: Stormpulse expands to the Pacific basin
Please note: the full-screen view and the Stormpulse API do not yet work for the Pacific basin. We are working to resolve this in the near future. Update: Our embeddable maps now work for the Pacific basin. Our API instructions have been updated to show you how.
One of the most popular requests we received last year was for us to broaden our coverage from the Atlantic to the Pacific basin.
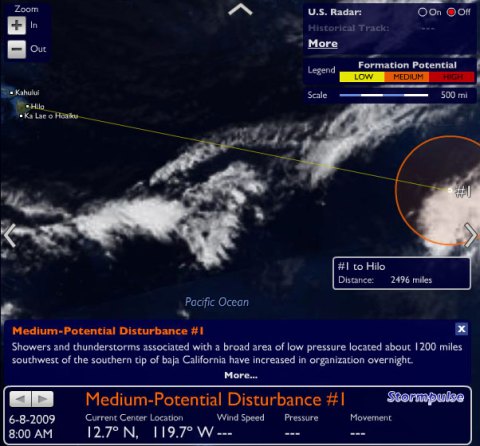
So, after rolling up our sleeves in the off-season, we quietly launched our coverage of the Eastern Pacific basin on May 15th (coinciding with the 1st day of the Eastern Pacific season).
We’ve added storm information back to 1949, buoy reports, wind probabilities, and satellite imagery. Something we don’t have yet: forecast/spaghetti models. Our source for the Atlantic spaghetti models (the South Florida Water Management District) does not provide this data, so we’re looking for a source. If you know where we can get fairly clean text data for model tracks in the Eastern Pacific, let us know!
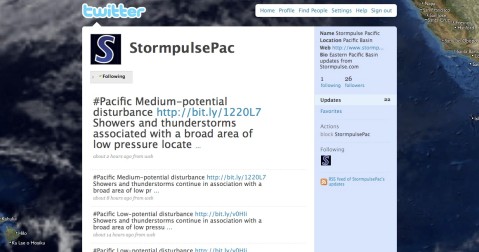
Additionally, you can get automatic updates on changes in Eastern Pacific Basin storms via our Stormpulse Pacific twitter account: @stormpulsepac.
Hope all of your out west and out in the big blue sea find this helpful. Send us your feedback when you get a chance (and let us know where can find spaghetti model info if you happen to know!).
Happy birthday: Stormpulse turns 4!
This week, Stormpulse turns four years old. The site began as a just-for-fun project in mid-September of 2004. Back then I was calling it ‘canewatch’–the name of the folder on my laptop that held all of the little PHP scripts that grabbed XML from the National Hurricane Center and parsed the massive HURDAT file containing all of the best track information back to 1851.
An excerpt from my first blog post about it, from September 21st, 2004:
National Hurricane Center / Tropical Prediction Center — my latest web project involves hurricanes. Twelve hundred of them to be exact. Well, including tropical storms. Can’t share much detail but the theme of the story is that I’m tired of the cartoon renderings that currently pass as meteorological forecasts and have embarked on a journey to bring information rich interactive displays using hurricane data to the general public. I’ve also been waking up between 4:00am and 5:30am in the morning to plug away at this, as my life with a now-nine-week old is rather full!
And another:
To supplement the quasi-dearth of creative challenge at my workplace, I’m currently coding away for what will be stormpulse.com, a real-time updating hurricane tracking site. Nothing there yet, but my PowerBook is gladly accepting a pummeling of data as I build the MySQL back-end. This is an exciting project in many ways. From a social benefits standpoint, I truly believe people deserve better than the cartoon-like graphics and information they get from their local weather service. Technologically, it’s loaded with challenges of integrating multiple data sources by fetching live feeds and simultaneously calling on the historical data that will be stored as well (all of the tracking information since 1851). For the geeks out there, it looks something like: Original input + fetched data (Cron jobs) –> [MySQL] <– PHP –> [XML] <– XML Connector –> [Flash]. Yesterday I downloaded 32,000 GPS coordinates for the state of Florida. Fun! :-D
That old personal blog also contains a few posts commenting on Hurricane Frances, the storm that most directly inspired me to write the code (my family was and still is in West Palm Beach, near Frances’ ultimate landfall). For those of you interested in startups, you may want to read more about our beginnings here at Stormpulse.com.
What have we accomplished in four years? We’ve launched a site, we’ve heard a lot of great feedback, we’ve assimilated that feedback, and we’ve received more visitors in the last three weeks than we ever thought possible.
Which brings me to a very big ‘THANKS!’ to all of you that have helped spread the word. Thank you!
Interrogative statements commonly found in our Gmail inbox
To improve our communication, we now have a Frequently Asked Questions page.
Aren’t you glad you asked? :-)
Like Stormpulse? Leave a tip with Tipjoy.
This morning we released a small update that allows appreciative users to ‘tip’ Stormpulse, Inc. with a small donation. This actually comes at the behest of our audience–that we ought to be making money with the site, or at least covering our expenses. :-) Yes, we really did have a user ask how they could submit a donation. So there you have it.
The default amount is 10 cents. If you would like to give more, you can. When you give any amount, you are asked to fund a tipjoy account with $5, which you can then use to tip any other site in the tipjoy network.
If you change your mind after submitting a tip (i.e. you’re not interested in funding your tipjoy account), you can easily cancel your tip by going to your transaction history page and clicking ‘cancel unpaid items.’ We promise we’ll still let you use the site and treat you kindly.
Stormpulse product page on Facebook
If you’re not too busy tracking the tropics …
For those of you that use Facebook, you can show your support for our site and join the conversation about storms, new features, and bugs by befriending Stormpulse.com. This is also a great way to subscribe to updates (if you’re not a regular blog reader).
Stormpulse.com Product Page on Facebook
Thanks for all of your continued feedback. We’re putting together a “Testimonials” page to highlight the awesome response we’ve been getting. Later today we’re rolling out a few more bug fixes, and in the days following, U.S. doppler radar.
Thanks for using Stormpulse.com!
Welcome, and a review of features
This blog is intended to keep users of Stormpulse.com up-to-date on the current status of the site, to solicit and respond to feedback, and to provide a place where you can comment on what you would like to see on the site next. I’d like this to be not just a platform, but a conversation piece. As we make announcements and improvements to the site, we want your feedback–not because it’s flattering that you would take time out of your day to do so (although it is), but because your feedback will be the lifeblood of this site, and whether it serves your needs during hurricane season.
I’d like to take the opportunity to tell you what the site does so far, since the interface isn’t so far along that these things are obvious:
- You can view hurricanes and hurricane season dating back to 1851 by entering in a URL such as: http://www.stormpulse.com/hugo, or http://www.stormpulse.com/1944.
- Cloud cover (updated every 6 hours) is available back to 2005. Coverage is still a bit spotty and you may notice some to be missing. In time (literally a matter of weeks), we will have cloud cover back to 2002.
- The map interface is meant to be like that of Google Maps–you can click or drag your mouse to pan, and use the + or – buttons at the top-left to zoom in and out.
- Clicking a city when a storm is active provides you with wind probabilities for that location over the next 5 days. On the other hand, clicking on a city doesn’t do anything (yet) when the storm you have selected isn’t an active cyclone. However, it will draw a yellow line and provide the distance from the selected storm (and plotpoint) and the city over which you hover your mouse.
- You can interact with storm data at the most granular level by clicking on a plotpoint in the storm’s track. This will jump you to that point in the storm’s history.
- We currently have issues with Internet Explorer and the site. If you want to get the most out of the site, we strongly recommend Firefox.
- Clicking on a storm in the “2006 Storm Season Summary” should open up a historical description of the storm and pan over to the storm in the map window.
- Satellite images update every half-hour or so. We are collecting water vapor, infrared, rgb, visible, and more, but only displaying rgb and ir for now. This will change in the near future, hopefully with a better way of organizing them as well.
- Yahoo! News articles are brought in from around the web relating to ‘hurricanes’.
- Present weather conditions for land and sea stations are available in a table-format down below the satellite images.
- Photos are being pulled in from Flickr that relate to the content ‘in focus’. This works on a limited basis, but if you want to give it a try, go to http://www.stormpulse.com/katrina and watch the photos change in the ‘Tropical Weather Photos’ area of the page–they should go from photos for the 2006 hurricane season to images captured during Katrina.
Those are some of the features of the site for now. Please let us know what you think and what else you like to see. While we could do many, many things, right now we want to make sure we do one thing well—satisfy the primary needs you have for a site during hurricane season, and, in whatever measure possible, do it in a way that is intuitive and beautiful.
 Comments (2)


